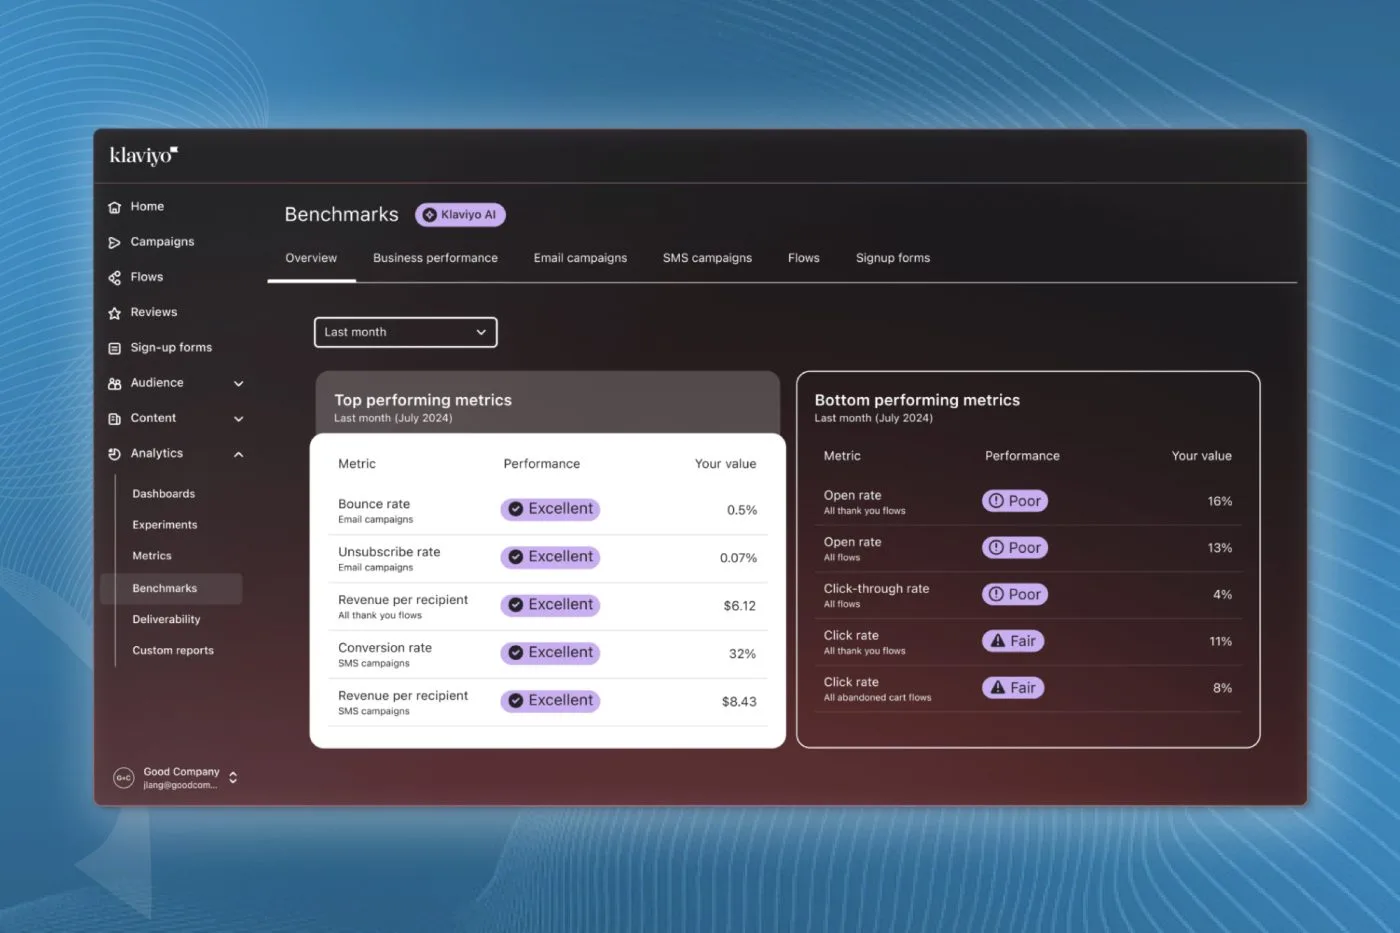
Most ecommerce brands judge their Klaviyo flows entirely on revenue. If the flow brings in cash, they leave it running indefinitely. That is a mistake.
An automated email can make a modest amount of revenue while simultaneously destroying your sender reputation. If an email produces an unsubscribe rate close to 4% or spam complaints above 0.25%, mailbox providers like Gmail and Yahoo take notice. Over time, that single message drags down the inbox placement for every campaign and automation you send.
To fix this, you need a message-by-message deliverability audit. Here is how I build a custom deliverability report in Klaviyo to spot problem emails quickly.
Building the Custom Flow Report in Klaviyo
Klaviyo has a built-in report library that makes pulling message-level metrics straightforward. You do not need to click into every individual flow builder to find your problem children.
Head to the left navigation menu in your Klaviyo account, click Custom Reports, and select the Reports Library. From the options presented, choose the Email deliverability by flow pre-built report.
Here is how to configure the report settings properly:
- Report Name: Name it something clear, like "Flow Deliverability and Revenue Audit".
- Metrics: Include Email Recipients, Open Rate, Click Rate, Unsubscribe Rate, Bounce Rate, and Spam Complaint Rate.
- Conversion Metric: Add Placed Order (Sum of value) so you can compare inbox health against actual sales.
- Group By: Set this to Flow Message so the report isolates individual emails rather than aggregating the entire flow.
- Timeframe: Select All Time (or the last 90 days if you recently overhauled your account).
- Filter: Check the box to Exclude archived flows to keep the data clean.
Once selected, save and run the report. Klaviyo will return a table showing every live message across your entire automated ecosystem.
Exporting and Cleaning the Data in Google Sheets
While Klaviyo shows the table inside the interface, I prefer exporting the raw CSV and loading it into Google Sheets. A spreadsheet gives you total control over sorting, filtering, and conditional formatting.
Export the CSV, open a blank Google Sheet, and import the file. Before analysing the numbers, I make a few quick formatting adjustments:
- Delete unnecessary columns: Remove Flow ID, Message ID, Channel, Status, and Tags. You only need the flow name, message name, recipient count, engagement rates, negative metrics, and revenue.
- Freeze the header row: Bold row 1 and freeze it so the column headers stay visible when scrolling down hundreds of messages.
- Format percentages: Klaviyo exports rates as raw decimals (for instance, 0.04 instead of 4%). Select the rate columns and format them as percentages so the data is readable at a glance.
Once formatted, sort the sheet by Unsubscribe Rate (Z to A). This immediately pushes your most toxic messages right to the top.
Analysing the Toxic Emails
When you look at your sorted data, you are looking for the trade-off between negative signals (spam complaints and unsubscribes) and positive outcomes (placed orders).
Here are two common scenarios you will run into and how to handle them:
Scenario 1: High Unsubscribes and Zero Revenue
In a recent audit, we spotted a win-back email with a 46% open rate, a 1.25% click rate, an unsubscribe rate near 4%, and a spam complaint rate of 0.27%. The total revenue generated across all time was exactly $0.
That email is actively sabotaging the domain. Turn it off immediately. If a win-back email does not convert and causes nearly three spam complaints per thousand recipients, keeping it live is pure downside.
Scenario 2: High Unsubscribes with High Revenue
Sometimes you will find an email (frequently in a welcome series or abandoned checkout) with strong revenue, high click rates, but unusually high unsubscribe and bounce rates.
You do not want to turn off a high-earning email. Instead, you fix the underlying setup. High unsubscribe rates in a welcome flow usually mean people were subscribed without clear expectations (for example, a generic checkout checkbox or poorly phrased pop-up). Adding an explicit preference centre in the email footer can lower unsubscribes significantly.
How to Fix High Bounce Rates Across Flows
When reviewing the report, you might also notice high bounce rates in early automation steps, particularly in abandoned cart flows where users entered mistyped email addresses.
One simple rule I implement across nearly every flow is adding an exclusion trigger filter: Bounced email = 0 times in the last 30 days (or over all time). This prevents Klaviyo from repeatedly attempting to send automated sequences to addresses that recently bounced on a campaign or previous automation step.
Clean flows protect your sender reputation. If your automations keep sending to invalid inboxes, inbox providers will start rerouting your standard marketing campaigns to the junk folder.
Final Thoughts
Revenue figures inside Klaviyo can mask serious deliverability problems if you never audit individual messages. Running a custom flow deliverability report every quarter ensures you catch bad emails before they damage your overall domain health. Keep what converts safely, fix what is broken, and turn off the dead weight.
If you want our team to review your automations, deliverability, and account infrastructure, book an In-box account audit and we will find the leaks for you.